If you’ve watched documentaries about Hurricane Katrina’s human toll in New Orleans, you were likely moved to tears, as I was, when caregivers left wheelchair bound people to succumb to rising flood waters. In Playa de Ponce, we lived our own version of this horror during Hurricane Fiona in 2022. A neighbor passed away in their home, and because the waters remained high and impassable, no one could get to the house for several days. It is a horrific scenario that no one—not me, not my neighbors—ever wants to see repeated.
But to prevent these tragedies, we have to confront a uncomfortable truth: our policy blind spots have real human costs. When emergency managers plan using broad neighborhood averages, a bedridden neighbor or a family without a car gets completely diluted by the lower risk profiles of those around them. Treating a community as a single statistical block makes our most vulnerable neighbors invisible—and in the simplest terms, neighborhood-level statistical averages leave people behind to die.
Shifting from district-wide vulnerability scores to precise, household-level insights is an implementable tool for survival in the face of increasingly destructive storms. What we are learning is that we can provide rescue workers and neighborhood leaders with a definitive playbook: the exact knowledge of whose doors to knock on before the water rises.
The Flaw of the Spatial Generalization
The climate vulnerability literature makes one thing clear: vulnerability is unevenly distributed across geographic spaces, even down to households on the same street. During a crisis, some families have the means to recover quickly; others face immediate, life-threatening danger.
Unfortunately, standard policy discourse circumvents this reality by labeling entire neighborhoods with broad strokes like “high risk.” This spatial generalization creates a dangerous blind spot. National, regional, and even census-tract-level analyses obscure variations within small communities, leaving emergency response teams in the dark about which households are most at risk when the water rises.
Existing toolkits routinely fail us in two ways:
- Broad Spatial Scales: Macro-indices, such as the CDC/ATSDR Social Vulnerability Index (SoVI), map vulnerability at the census tract level. They miss critical, localized lived realities—like a family’s dependence on medical devices requiring electricity, informal caregiving networks, structural housing deterioration absent from tax records, or volatile informal incomes.
- Purely Qualitative Approaches: While rich in human detail, purely narrative strategies make it difficult to compare vulnerabilities across different sectors, hindering disaster responders from prioritizing households objectively during an emergency.
To bridge this gap, the community-based organization Un Nuevo Amanecer, Inc. (UNA), alongside a dedicated committee of residents, set out to customize an empirical vulnerability assessment. Funded by the Climate Smart Communities Initiative (CSCI), UNA built a team of contractual technical service providers and lived-experience experts, collaborating with the Municipality of Ponce’s Office of Emergency Management and the Climigration Network. Our goal was to design a locally grounded, empirically rigorous survey instrument capable of capturing multidimensional vulnerability at the household level.
The Theoretical Landscape: A PI’s Perspective
As the Principal Investigator (PI) for this initiative, I set out to address this methodological gap. Although UNA’s dedicated contractors led the pilot interviews and day-to-day community co-production, I provided the research direction. I spent months testing the waters and grounding my motivations in multiple community meetings, listening intently to the anxieties and lived experiences of our residents to ensure that the intended research matched our reality.
I then searched literature on household-level survey instruments and reviewed established conceptual frameworks to balance statistical rigor with local responsiveness.
First, I examined the Community Assessment for Public Health Emergency Response (CASPER), an epidemiological field survey tool designed for rapid, “boots on the ground” sampling during or immediately following a disaster. Utilizing a two-stage cluster sampling design, CASPER randomly selects clusters (like census blocks) and then samples specific households within them. While CASPER has been deployed in Puerto Rico for acute emergency needs, it is effectively blind to structural inequities. It can tell emergency managers that a specific sector is short on clean water, but it fails to analyze the systemic poverty or infrastructure failures that caused the vulnerability in the first place.
For a more proactive and structural diagnosis, I pivoted to the Livelihood Vulnerability Index (LVI) and its IPCC-aligned variant, the LVI-IPCC, developed by Hahn et al. (2009). This framework incorporates seven livelihood vulnerability factors into three core dimensions:
- Exposure: The degree to which households face natural hazards and climate variability.
- Adaptive Capacity: The capacity of households to adjust to or withstand these changes.
- Sensitivity: The extent to which households are directly or indirectly affected by climate impacts.
On the livelihood sub-dimensions covered the following: Socio-demographic Profile, Housing & Infrastructure, Natural Hazards & Climate Variability, Livelihood Strategies, Food Security, Social Networks, Health.
Mathematically, the framework calculates a household’s vulnerability on a scale ranging from -1 (least vulnerable) to 1 (most vulnerable). The LVI-IPCC method used by Abu et al. (2015) first calculated weighted averages for each survey question along the three dimensions. Then the household weighted averages were calculated into a household-level Livability Vulnerability Index using the following formula:

A positive index score ( >0 ) means a household’s exposure outstrips its ability to adapt, amplified by underlying sensitivities. While originally designed for farming communities in Mozambique, the flexible, data-driven LVI-IPCC framework has been adapted across the Caribbean—from Trinidad and Tobago (Shah et al., 2013) to Jamaica (Campbell, 2014). More recently, Nazakat et al. (2025) underscored the value of connecting educational attainment, resilient housing adaptations and emergency procedures for families, and social capital support systems for studies within small island contexts.
Raíces Costeras: Co-Producing Granular Data
Most LVI-IPCC applications aggregate data at the community or district level, which once again masks internal variation. As Adu et al. (2017) demonstrated in their studies of households in two Ghana municipalities, aggregated scores hide households with extreme vulnerability profiles that require immediate intervention. In Playa de Ponce, where flood risk, medical needs, and social isolation differ sharply across our barrio’s 19 sectors, a household-level index is essential for effective emergency action. A community organization, such as UNA, cannot plan an efficient evacuation or target backup power distribution based on a neighborhood average.
Through UNA’s community co-production initiative, Raíces Costeras (Coastal Roots), we designed, piloted, and validated a household-level survey instrument grounded in the LVI-IPCC framework. The survey was co-designed through a participatory framework involving UNA’s technical team and an eight-member Community Advisory Committee (CAC) representing six of Playa’s sectors. These residents shaped our question design, refined response options, and aligned the language with the community’s everyday vocabulary.
Early Insights from the Pilot
The pilot was administered via ArcGIS Survey123 and implemented on two handheld tablets connect to the cloud and cell phones. It captured exact household GPS coordinates alongside survey metrics across a convenience sample of 52 households and six neighborhoods. This enabled me to calculate the first household-scale vulnerability index scores in Barrio Playa.
The initial findings, while not generalizable, revealed stark within-barrio variations. Against an overall pilot mean score of -0.037, sector mean scores varied widely:
- Puerto Viejo (Most Vulnerable): +0.032
- Residencial Caribe (Least Vulnerable): -0.090
Crucially, the index isolated one High-tier vulnerable household and 21 Moderate-High households, giving UNA precise, actionable priorities for possible intervention right out of the gate.
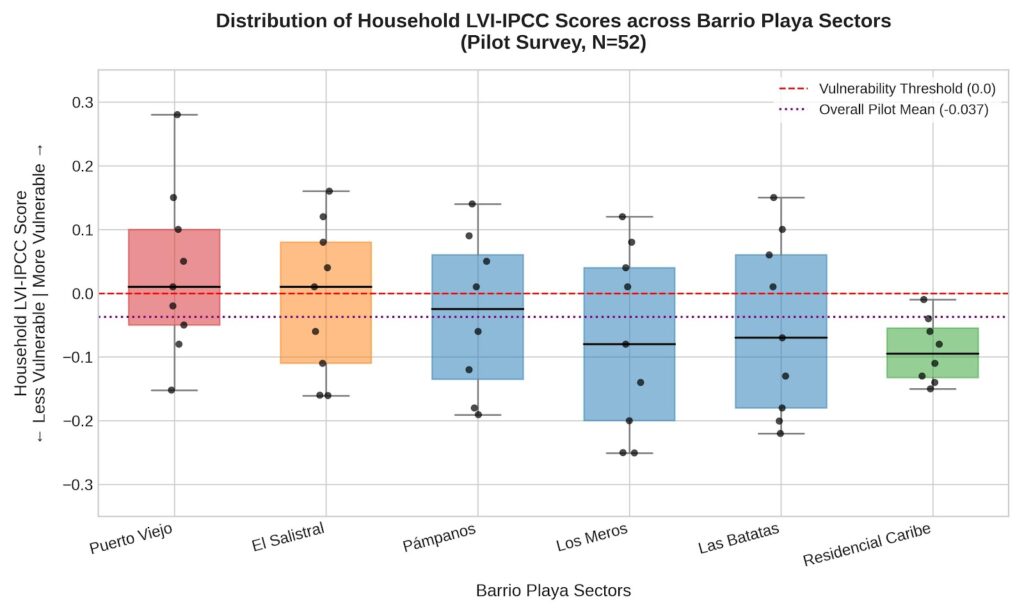
Figure 1: Distribution of Household LVI-IPCC Scores Across Barrio Playa Sectors (N=52). Individual household data points are horizontally jittered over sector box plots to preserve raw data density and prevent overlap. The red dashed line (0.0) marks the critical vulnerability threshold where climate exposure outstrips a household’s adaptive capacity. The purple dotted line (-0.037) represents the aggregate pilot average, visually exposing how community-wide averages mask severe household-level realities.
Moving Forward
By securing georeferenced data, we can now overlay our social vulnerability index directly with FEMA flood zones and NOAA sea-level rise layers in GIS. This allows us to see exactly where physical exposure and social vulnerability compound at the household scale.
More importantly, however, true climate resilience cannot be achieved through a top-down, aggregated lens; it requires localized, empirical precision. Bringing lived-experience experts to the table ensures that our data remains tethered to cultural and lived realities. Furthermore, piloting the survey acted as a vital diagnostic tool. It revealed precision issues with a couple of double-barreled questions and exposed an important oversight: the critical omission of indicators tracking household access to backup supplies of potable water.
In the simplest terms, we learned that we do not have to conform to policy blind spots. Household-level data gives people a fighting chance. When emergency managers plan using broad neighborhood averages, a bedridden neighbor or a family without a car becomes invisible, as their vulnerabilities get diluted by the lower risk profiles of those around them. I am hopeful that this granular data approach will serve as an implementable tool for survival in our and other communities.
